Web browsers generally have consoles, which are interactive command lines where you can print text and test pieces of code.
This is where, for the most part, you’ll be debugging your javascript code and checking out for errors.
How To Open The Console
To open up the console for any browser.
- right-click on your webpage and choose “inspect” or “inspect element” if you’re on Safari browser.
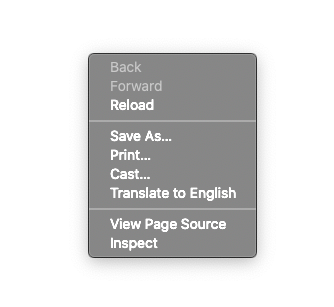
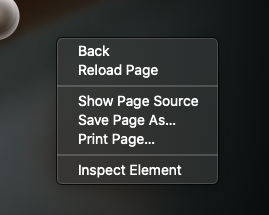
2. Next, select console
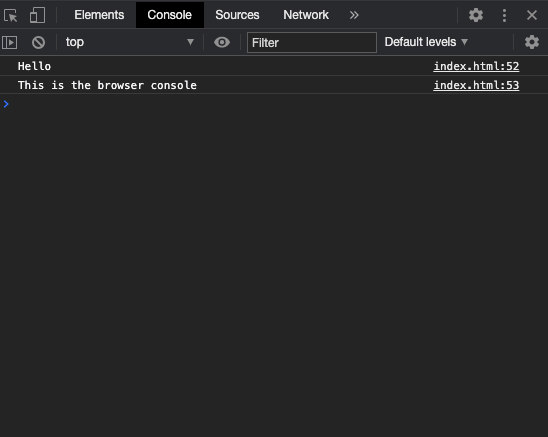
Printing Values Using console.log()
console.log("Hello");
console.log("This is the browser console");

//Output:
//Hello
//This is a browser console
Printing Multiple Values
console.log('abc', 123, true);
//Output
//abc 123 true
Printing Strings With Substitutions
Here are some directives you can use for your substitutions:
%s: converts the corresponding value to a string and inserts it
console.log('Value: %s %s', 123, 'abc');

//Output
//123 abc%o: inserts a string representation of an object
console.log('%o', {foo: 123, bar: 'abc'});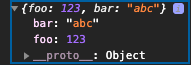
Notice that result is an object.
%j: converts a value to a JSON string and inserts it
console.log('%j', {foo: 123, bar: 'abc'});
%%: inserts a single %
console.log('%s%%', 100);

//Output
// 100%
Printing Error Information Using console.error()
console.error() works typically the same way as console.log(), but what it logs is considered error information.
About the Author

Latest tech news and coding tips.